Resources for Week #4: Textual Analysis & Data Visualization

Textual Analysis Ideas
- Open Google Doc (Lindsey’s notes)
Today’s Tools
Reading
- Tooling Up for Digital Humanities (Stanford)
- The Data Journalism Handbook (see especially Chapter 7, “Using Data Visualization to Find Insights in Data”)
- Lev Manovich, “The Algorithms of Our Lives” (The Chronicle of Higher Education, December 2013)
- What is Data in Literary Studies? (Arcade: A Digital Salon; Stanford)
Sample Visualizations & Textual Analysis Projects
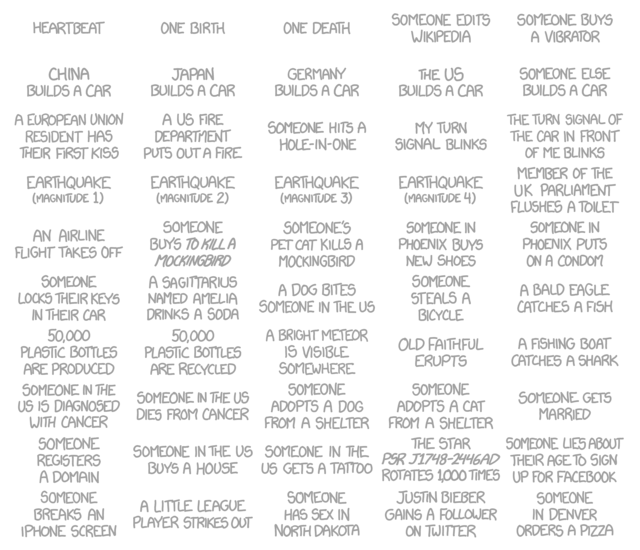
xkcd, “Frequency” (February 2014)
- David McCandless, Information is Beautiful (August 2009–present)
- Stanford University, Mapping the Republic of Letters (February 2011–present)
- Josh Begley: “The Subject of the Dream” (December 2012)
- Dennis Mansker: “Jack Kerouac’s On The Road Interactive Maps” (January 2013? Best guess according to the Wayback Machine)
- Nadav Hochman, Lev Manovich, and Jay Chow: “Phototrails: Instagram Cities” (July 2013)
- Josh Begley: “Empire.is” (December 2013) [see this article on Mashable for more information]
- Kiln, “Flights Interactive” (January 2014) [produced for and hosted by the Guardian]
- Josh Begley: “Metadata+” (February 2014) [watch the video demo, or download to iPhone/iPad from the App Store. Read more about the creator’s effort to get the app approved by Apple.]
- Trevor Paglen: “Overhead” (February 2014) [created in partnership with new awesome/scary mostly NSA-related news site, The Intercept]
- Maya Eilam, Kurt Vonnegut and the Shapes of Stories (February 2014)
Recent Comments