From The Peopling of New York City
What Do All These Numbers MEAN???
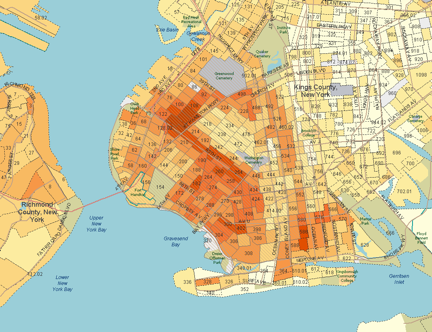
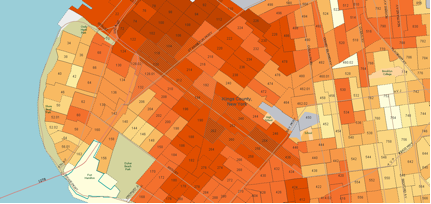
The following statistics paint a quantitative picture of Brooklyn's Chinatown. From the following maps, charts, and collected data, a few conclusions can be drawn. First of all, the center of Brooklyn's Chinatown is along 8th Avenue from around 65th Street to around 45th Street and most of the Asian families are originally from China and have children. We can see that these immigrants make less income per capita than white families from over 10 years ago! We can assume that this is in part due to the fact that around 30% of the heads of households here have less than a high school education. In America, which runs as a knowledge-based economy, the "non-skilled" labor jobs that are left for these immigrants simply do not pay as well. In keeping with history, which shows that Brooklyn's Chinatown first flourished in the 1980s, the mean age of heads of households here is 45 to 55. This is logical because most immigrants probably moved in around their 20s or 30s and have now raised families in the area. Hence, they are now in their 40s or 50s.
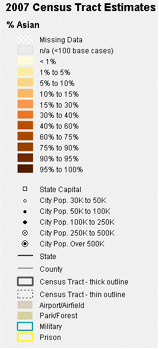
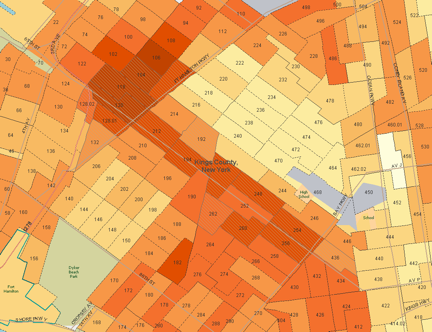
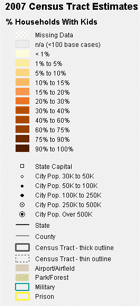
Along 8th Avenue, from around 65th Street to around 45th Street, there is a highly Asian population:
Of these Asians, almost half of the families have children:
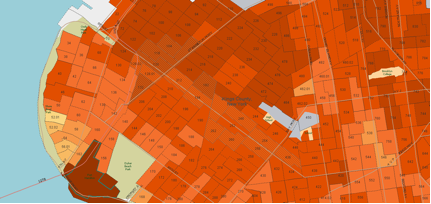
The Asian population is 94.4% Chinese in origin:
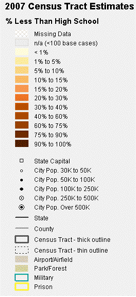
About 30% of these Chinese have less than a high school education:
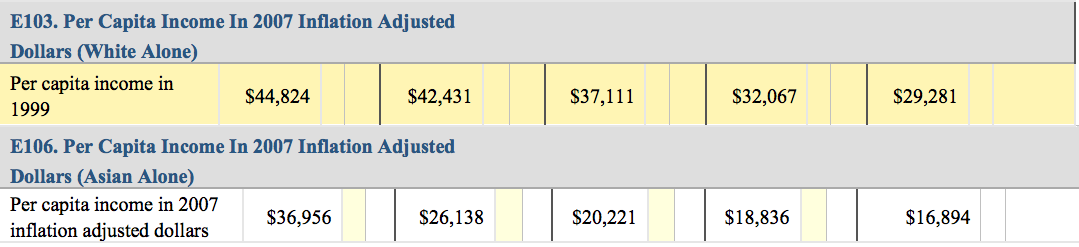
White families in 1999 were already making 120% of the per capita income of Asian families in 2007 in Brooklyn's Chinatown:
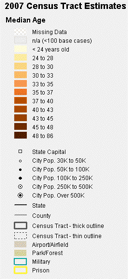
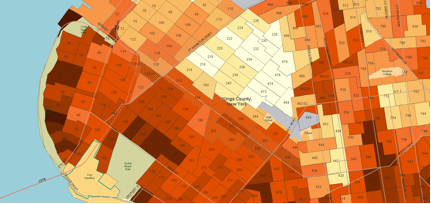
The average age of the head of a household in Chinatown Brooklyn is around 45 to 55 years old: