EBV
From Prof. Elston's Wiki
Abstract: In my project, "Environmental Benefits Valuation," I work in conjunction with the Energy group by taking their findings and calculating the monetary savings of the reduced pollution they project in a potential conversion of the remainder of the steam system to Cogeneration. I calculate the per ton cost of each pollutant, (SO2, NOx, CO, CO2, PMs, VOC) and then take their findings of the annual reduction of these emissions to produce my figures. "Cost" is determined by the environmental, health, and general liabilities of each of the pollutants in turn--then multiplied to reflect the total reduction.
Contents |
What Pollutants?
This project examines the emissions of seven pollutants and their respective costs.
SO2 or SOx
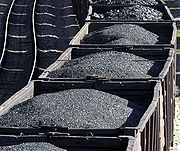
The first pollutant is SO2 (or SOx), known as Sulphur Dioxide or Sulphur Oxide, which is released (in decreasing order) by coal, oil, and natural gas in notable quantities. In coal, the disturbing amount of SOx emitted can be reduced by a limestone method [6] but advances in mitigating damages does not change the fact that the problem is pertinent and needs attention. 66% of all SOx emissions comes from energy generation! [7]
In gaseous form, SO2 causes respiratory, plant, and water damage. It also causes visual impairment. But it is arguably most dangerous when it clings to water particles and creates acid rain.
NOx
The next pollutant is NO2 (or NOx), known as Nitrogen Dioxide or Nitrogen Oxides (to refer to the combination of Nitric Oxide and Nitrogen Dioxide). It is a dangerous pollutant released by transportation vehicles and power plants alike. Nitrogen Oxides is linked to respiratory damage when exposure exceeds half an hour and is known to create harmful Particulate Matter that is so dangerous it merits its own division of this project's analysis (PM2.5 and PM10 are below) [8]. Furthermore, Nitrogen Oxide is a heat trapping gas which contributes to global warming.
Nitrogen Oxides are uniquely dangerous to those living by major highways or roads. This accounts for 16% of US housing units, approximately 48 million people, and entails increased NOx levels of anywhere from 30-100% (PM10 and PM2.5 are examined in this project) [9].
CO2
The dangers of CO2 are well documented and have become synonymous with the dangers of Global Warming. Carbon Dioxide traps heat which would otherwise escape the atmosphere. This heat is projected to increase the mean temperature of the earth as emissions continue. Carbon Dioxide is released by the combustion of fossil fuels such as oil, coal, and natural gas. This pollutant, simply because of the tremendous quantity being emitted, may be the most dangerous of them all. And though much global warming prevention efforts focus on the amount of carbon dioxide released by transportation vehicles, energy generation emits more carbon dioxide than any other source of emissions [10]!
Although use of coal is not as extensive in NYC as it is in the rest of the country, the concern over Carbon Dioxide Emissions is no less intense. Global Carbon emissions is increasing too dramatically for there to be slack in any one area, particularly one of the world's largest cities. "Since the Industrial Revolution in the 1700’s, human activities, such as the burning of oil, coal and gas, and deforestation, have increased CO2 concentrations in the atmosphere. In 2005, global atmospheric concentrations of CO2 were 35% higher than they were before the Industrial Revolution." [11]
PM2.5 and PM10


Particulate Matter 2.5 (PM2.5) and Particulate Matter 10 (PM10) are distinguishable by their size. PM 2.5 is 2.5 micrometers in diameter or less and PM 10 is between 2.5 and 10 micrometers. These are referred to, in turn, as "Fine Particles" and "Coarse Particles." These two types of particulate matter are particularly important because smaller than 10 micrometers in diameter means they can enter deep into a person's lungs and can even enter their bloodstream! [12]
These particles result in respiratory problems and a dangerous aggravation of pre-existing respiratory problems. They can even lead to premature death. In addition to respiratory difficulties, the ability for some of these particles to enter one's blood stream means that they can cause non-fatal heart attacks, irregular heart beats, and premature death in those with heart problems.
In addition to health effects, particulate matter has negative impacts on the environment. PM 2.5 is the leading cause of "haze" which reduces visibility on days that are not clear. Haze is created by the sun hitting particulate matter. [13] Particulate matter also has the potential to be carried over long distances and harms anything it eventually settles on. It causes acidity on water, nutrition imbalances on water and land, health damage on plant life, and even structural damage on stone. [14] Particulate matter is in part created by pollutants we are examining in this project, keep this in mind when reviewing the numbers we eventually produce.
VOC
VOC stands for Volatile Organic Compounds. This is a broad generalization of various organic compounds that emit pollution when used (and sometimes when stored). What makes VOCs so dangerous is that they are often found in household products and this can lead to indoor pollution being 2-5 times as intense as outdoor VOC pollution! [15] That being said they can be released with the burning/use of organic compounds and this includes energy generation's consumption of fossil fuels.
VOC's are very dangerous because there are so many of them. They vary from those that are clearly dangerous to those with no known negative health impacts. Here is the EPA list of effects, too long to simplify and still do justice: "Eye, nose, and throat irritation; headaches, loss of coordination, nausea; damage to liver, kidney, and central nervous system. Some organics can cause cancer in animals; some are suspected or known to cause cancer in humans. Key signs or symptoms associated with exposure to VOCs include conjunctival irritation, nose and throat discomfort, headache, allergic skin reaction, dyspnea, declines in serum cholinesterase levels, nausea, emesis, epistaxis, fatigue, dizziness." [16]
CO
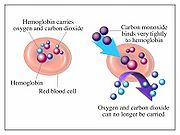
Carbon Monoxide (CO) is a dangerous pollutant because it is "odorless, colorless and toxic," not to mention potentially fatal. Carbon monoxide is sometimes used as a suicide method, which partially inflates its numbers..."Each year, more than 500 Americans die from unintentional CO poisoning, and more than 2,000 commit suicides by intentionally poisoning themselves"...according to the Center for Disease Control [17]. Carbon monoxide replaces oxygen in the blood stream which can lead to unconsciousness and eventually death in high concentrations.
In the context of energy generation, carbon monoxide is significantly reduced as an emission in the steam system as compared to a home boiler system. Home Boilers are one of the greatest emitters of Carbon Monoxide. Furthermore, the gas is released during the combustion of fuel such as that used in steam power plants.[18]
Costs
This project analyzes the costs involved with these pollutants so that an educated monetary prediction can be made for their reduction.
How costs are calculated
The "costs" in this project are just as the title implies--a valuation of the environmental benefit. But as we are dealing with pollutants, we are dealing with what amounts to opportunity costs, ie what we do not suffer when we do not pollute. These costs vary from pollutant to pollutant based on their various health and environment damages. SOx, NOx, and the PMs are all linked to respiratory problems on even a minor-contact scale. This means widespread danger even though that danger is rather minor. For PMs and CO, however, heightened exposure can lead to death! And at the risk of putting a dollar value on a human life, this is considered a rather significant cost. VOCs and CO act a little differently from the other pollutants, having odder symptoms or exposure situations, but they follow the same general idea.
The clearest single indicator of the effects of pollution in many valuations is the reduction of quality of life. But the most difficult to calculate (also the most studied) is CO2, where its effects on global warming can be apocalyptic by some measures. Once again, risking putting a dollar value on the end of time is difficult. The studies from which dollar values are drawn try and quantify health issues, or environmental damage, and stay away from theoretical costs such as apocalypses. It is more effective to say that a pollutant has such and such a dollar value per ton, and it can ALSO cause serious damage that cannot be calculated.
Environmental damage is measured by disruption of agriculture and water supply, death or disruption of plant life, air quality reductions, and many other factors that cost the city and state money to repair and live with. Many factors go into evaluating the damages of these pollutants and also making sure those calculations apply to New York City, where our presentation takes place.
"Hidden Costs of Energy": Coal and Natural Gas
Before we get to the $ value that studies have endeavored to provide, let us first understand the environment of electricity generation in the United States. According to an Academy of Science Executive Summary on "Hidden Costs of Energy: Unpriced Consequences of Energy Production and Use" [19], because some plants use coal the national numbers are skewed compared to New York City where we use the more efficient gas and oil. Coal plants themselves are very diverse however, as this paragraph in the summary notes, "The aggregate damages associated with emissions of SO2, NOx, and PM from these coal-fired facilities in 2005 were approximately $62 billion, or $156 million on average per plant. But the differences among plants were wide—the 5th and 95th percentiles of the distribution were $8.7 million and $575 million, respectively. After ranking all of the [coal] plants according to their damages, we found that the 50% of plants with the lowest damages together produced 25% of the net generation of electricity but accounted for only 12% of the damages. On the other hand, the 10% of plants with the highest damages, which also produced 25% of net generation, accounted for 43% of the damages." The number, $156 million per plant, does not take into account effects on global warming or the costs of VOCs or Carbon Monoxide. But the study found crucial numbers nonetheless, "If plants are weighted by the amount of electricity they generate, the mean damage is 3.2 cents per kWh." As the study moved past coal, one got the sense that pollution causes a lot of monetary damage, to the extent that if the generators were held responsible they would have to reduce it. This seems to be the path that they are on though, as pollution damage costs seem to be decreasing.
Natural gas offered far more reasonable numbers--"Average annual damages per plant were $1.49 million, which reflected not only lower damages per kWh at gas plants but smaller plant sizes as well; net generation at the median coal plant was more than six times larger than that of the median gas facility...mean damages per kWh were 0.16 cents when natural gas-fired plants were weighted by the amount of electricity they generated." Natural Gas and Oil is far less pollutant than Coal, and leaves our NYC plants on the favorable side of pollutant calculations.
But these costs, calculated for a combined SOx, NOx, PM 2.5, and PM 10 are often within the summary put in direct contrast to "climate change damages" which have separate and comparable costs. Climate change is primarily the result of Carbon Dioxide emissions. More and more the study distinguished the two, and favored the more quantifiable non-climate costs, "The climate-related damages were higher than the non-climate damages from natural gas-fired power plants, as well as from combustion of natural gas for producing heat, regardless of the marginal damage estimate. Because natural gas is characterized by low emissions that form criteria pollutants, the non-climate damages were about an order of magnitude lower than the climate damages estimated by the models, if the marginal climate damage were assumed to be $30/ton CO2." Unfortunately the complexities of calculating Climate Change costs overcame even this academic summary and the $30 figure is not officially espoused by the academy.
$/ton of PM 2.5, SOx, NOx, CO2, and VOC
Now we come to the numbers that this project is all about! Let us get right into it...
The most significant single document I came across in my research was "The influence of location, source, and emission type in estimates of the human health benefits of reducing a ton of air pollution" by Neal Fann & Charles M. Fulcher & Bryan J. Hubbell. [20] This study could not have been more on the dot. It analyzed electricity generation units separately from other forms of emissions, it looked at New York City in particular (distinguishing location was this articles claim to fame), and it covered Carbon Dioxide, VOC, NOx, and SOx.
First let us look at their SOx estimates for an energy generation unit. The study found that every ton of SOx produced in New York City costs $74,000. This is slightly less than their national cost of $82,000 and a far cry from the most expensive place to produce it that they found which was San Joaquin ($350,000).
Next was their NOx estimates. Every ton of NOx produced costs NYC $1,500. Again this was far below the national average of $15,000 or the city-high (Seattle) of $120,000.
But Carbon and VOC would tell a different story. For every ton of VOC produced, NYC pays $4300. This is almost double the national average of $2400 and is second among cities. Carbon was far and away the most expensive of the pollutants and NYC was among the most expensive. For every ton of carbon produced, NYC loses $780,000. This is far more than the national average of $460,000.
Because this study covers so many of our pollutants, let us look into their methodology. The study comes from the angle of analyzing PM 2.5. It found the EPA, in an understandable effort to homogenize results, had disregarded the significant effects of location and source on the costs of various emissions that help form PM 2.5 (namely SOx, NOx, CO2, and VOC though the study does look at more than those).
"Accounting for the key sources of heterogeneity is especially important when estimating the formation of, and the resulting benefits of reducing, fine particulate matter, or PM. Three inter-related sources of heterogeneity affect the magnitude of PM2.5 $/ton estimates. The first relates to the chemical processes that govern the formation of PM2.5 in the atmosphere. Ambient PM2.5 is a complex mixture of primary and secondarily formed particles, resulting from chemical interactions in the atmosphere and physical transport of emissions of particulate matter precursors, including available SO, NO, and NH, meteorology (particularly temperature), and baseline levels and composition of PM2.5. The complex nonlinear chemistry governing PM formation suggests that the impact of reducing precursor emissions could be very different across areas due to base conditions at both the emitting source and the receptor areas. As such, it is important to account for this variability when estimating the benefits of reducing a ton of PM2.5 precursor."
The study continues on to explain that heterogeneity did indeed provide far more appropriate results and we were fortunate enough to have an important enough city to merit investigation in their study. The study relies heavily on "BenMap" which is the EPA's benefit analysis machine. They also use EPA's response surface model to further their efforts to distinguish individual city environments and atmosphere (and their respective vulnerabilities). And would you believe it, mortality was such an issue that they did indeed put a value on the human life--$6,200,000. Just for fun reference, this is the amount of money that Wikipedia raised in a recent donation-request effort and is the cost of 10 kilometers of the disneyland monorail system. The explanations for the high carbon costs compared to the other pollutants has primarily to do with how close to the population and with what PM 2.5 levels it is emitted. While we examined the 59th street power station, most emissions of other materials such as NOx do not affect the population as immediately and intensely as Carbon...hence the bloated costs.
The study recognizes the dangers of these pollutants separately from PM 2.5 but one gathers from the study that it believes they have the secondary result of forming PM 2.5. No specific number value is actually given to PM 2.5 but one can only assume that it is at least higher than any of the pollutants who form it--which leads us to a number over $750,000.
CO and PM 10
Carbon Monoxide was a fascinatingly difficult $/ton to calculate because the numbers are so varied and its use as a suicide method inflates numbers. If we are to take non-suicide deaths per year (500) and multiply that by EPA's value of a human life (6.2 million) and then divide that by the tons of CO emitted per year we would still lack the quality of life costs and the damages caused by the flu-like symptoms of partial exposure.
PM 10 does not have as much research done into it as PM 2.5 because it is a less dangerous form. PM 10 is those particles slightly larger than PM 2.5 so that they can still enter deep in our lungs but not AS deep as PM 2.5. Because of this, most numbers are related to PM 2.5 when it comes to valuation of reduction. That being said, one can safely say that because it is not as damaging as PM 2.5, it will not be as costly.
Tons of Emissions/year
According to the Energy Group [21], here are the annual reductions in pollution by a conversion of the 59th street power station to Co-Generation...
Pollution with Current Use: 515 tons per year of SO2, 716 tons per year of NOx, 1,392,962,992 tons per year of CO2
Pollution with Co-Generation: 331 tons per year of SO2, 363 tons per year of NOx, 987,786,542 tons per year of CO2
Reduction by Conversion: 184 fewer tons per year of SO2, 353 fewer tons per year of NOx, 405,176,450 fewer tons per year of CO2
$/year
Now our efforts come to a close with simple multiplication:
184 fewer tons of SO2 x $74,000 saved for each ton = $13,616,000 saved each year in environmental benefits
353 fewer tons of NOx x $1,500 saved for each ton = $529,500 saved each year in environmental benefits
405,176,450 fewer tons of CO2 x $780,000 saved for each ton = $316,037,631,000,000
For a combined total value of $316,037,645,145,500 per year in reduced health and environmental damage to NYC
PowerPoint Presentation
Video

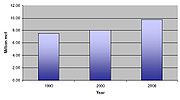
![[5]](http://www.a2gov.org/government/publicservices/systems_planning/energy/PublishingImages/Updated%20Natural%20Gas%20Use.jpg)