FOOD
From Prof. Elston's Wiki
Food Production and Consumption In New York
Abstract Production: This group's research focuses on where food comes from, how it gets to supermarkets, and how much energy is expended in the process. Our research works around several key terms that we have defined- foodshed, local food, and consumer market. We have researched what kind and how much of food is produced on farmland in New York State. We investigated the methods used to produce that food, and how the food is transported to supermarkets in order to reach the NYC consumer market.
Abstract Consumption: This group's research focuses on how much meat and dairy is consumed in the NYC consumer market. We have researched how much carbon dioxide (CO2e) is emitted from the production and transport of those foods, our measure of how much that food consumption contributes to the greenhouse gas problem. We have researched the amount of meat and dairy the average person in our consumer market eats, and what would happen to the levels of carbon if these people did not eat meat for one day a week.
Introduction: The Food Shed
A Foodshed outlines or maps out the flow of food that feeds a particular area. It is composed of the farms that produce the food and the stores in which you purchase the food, all the way to your dinner table. The current US foodshed includes the entire world. Our food transverses the globe to reach our tables. Most of the time, food can travel back and forth to different processing plants plenty of times before it actually reaches us. Foodsheds are very useful in describing local food systems. If we look at our agricultural system in terms of the origin and pathways of our food items, it becomes easier to expand these pathways and focus them on a local level. [4]
Local Food: The importance of local food is that consumers can know where their food comes from and how it is made. The products will arrive quicker and fresher than products outside of the foodshed and can reduce or eliminate the need for chemical preservatives, making food healthier for consumers. Their is a potential for lower costs than commodified food and the potential to lower our carbon footprint with the support of local farms and businesses.
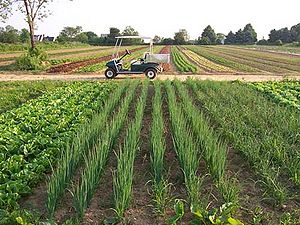
Food Production In New York
The New York City Regional Foodshed Intiative expands the analysis of of the regional capacity to produce food and look deeper into local food production capacity of the NYC metro area. Looking at land use, soil type, transportation, infrastructure and climate conditions contribute to the food production of local farms. [5]
Mapping foodsheds help to :
- Look at specific areas of vulnerability
- Ways to enhance foodsheds
- Quantify regional food production capacity and consumption
- Increase access to affordable, healthful food in all NY neighborhoods.
Land Use in New York State
Development vs Open Space
Only 4.4 percent of land is dedicated to residents.
Open space:
- 24.8% Farmland
- 62.8% Forest [6]
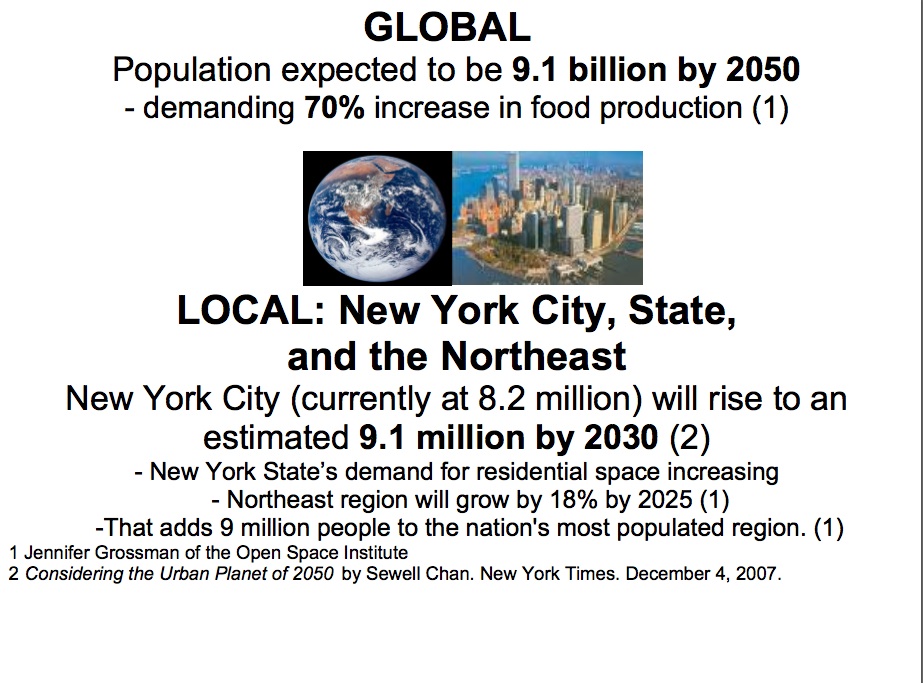
The population of the city and the megaregion that relies on the same foodshed is increasing. Thus it is important to consolidate populations into energy efficient urban living space, and preserve the rural countryside that provides food.
Disappearance Statistics
   * Growing Residences caused NYS to loose farmland
     - At a rate of two acres per minute in the US
       - at a rate of 26,000 acres per year in NYS
      -From 2002 to 2008 alone average farm
       profits reduced by 45%
      - 30% faster in the 90s than in the 80s
      -In 2001 farms covered just over 7.6
       million acres of NYS
      -By 2008 that number
       was reduced to 7.1 million
(Figures provided by Jennifer Grossman of the Open Space Institute.)
The Local Solution In order to preserve disappearing farmland and keep local farmers in business, consumers should start buying more local food products. Local food's transportation is less carbon intensive because it travels less, reducing GHG emissions. Additionally, fresher food has more nutritional value.
New York Agriculture
New York Agriculture at a Glance
New York is an agricultural state. There are currently 36,000 farms listed in the state of New York. They occupy approximately 7.1 million acres of land, which is equivalent to roughly 25% of New York land mass. Agriculture generates almost 3 billion dollars for New York economy, and yet most farms still operate as a family-run business. New York farmers produce a wide variety of crops and food items. For instance, New York produces close to 25 million bushels of apples annually. But not only that, it also produces more commercial variety of apples than any other state. Additionally, New York is also ranked 3rd in the quantity of milk produced per year [7].
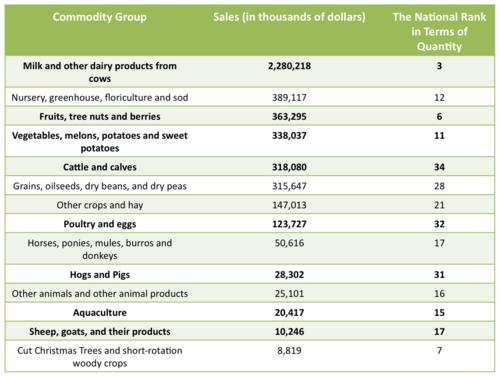
What Gets Produced in New York Farmlands?
New York farms produce a wide variety of crop items. However, a large number of acres are used to grow crop items that are meant for hay and animal feed, as opposed to human consumption. For example, New York farmers currently utilize 1,962,620 acres of land to just grow hay, haylage, grass silage, and greenchop [8]. However, as it can be seen on the chart on the left, New York agriculture is also heavily preoccupied with growing crops for the purpose of human consumption. Some of its top crop items that are relevant for the concept of foodshed include: milk and other dairy products from cows; fruits, treenuts and berries; vegetables, melons, potatoes and sweet potatoes; cattle and calves; poultry and eggs; hogs and pigs; aquaculture; sheeps, goats and their products.
How Is The Food Sold?
Their are various methods in which the producer can sell their products. Some examples are:
- Direct Marketing
- Farmers markets
- Road side markets
- Subscription marketing
- Pick your own marketing
- Selling to Retail Market (Wholesale)
Direct Marketing
In Direct Marketing the supermarket gives 3.5 cents of every dollar to the farmer, compared to 80 to 90 cents at local food market. It is essential to the profitability of small-farm business ventures. Direct Marketing has many advantages. Farmers can potentially make higher profits because there is no middleman, save cost in packaging, handling, and transportation and money is received right away. Direct Marketing promotes a diversity of production and reduces the pressure to produce in high volumes. Farmers are free to grow what they want and to decide on quantity. They have the opportunity to set their own price within a marketable range. The disadvantages to Direct Marketing though is the volume of product you sell through direct marketing is often lower than what you would sell through other marketing methods. It Requires more of your time than other methods do and you need to be present at the market selling your product. In Addition convincing people that they should buy your product can be quite difficult. [10]
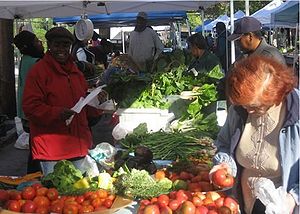
Farmers Market:Farmers market is ideal for new producers because start-up costs are low and only simple marketing skills are needed. There is Face-to- face contact between the producer and customer. Farmers’ markets have all the general drawbacks associated with direct marketing such as bad weather can be a problem. Also the producer’s level of comfort with being outside in various types of weather is a factor to consider. [11]
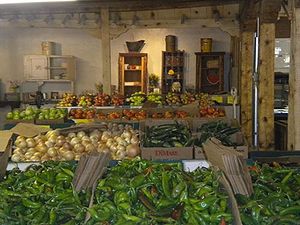
Roadside Markets: Roadside markets are fixtures along many highways and roads. It is a convenient place for the public to buy locally grown produce. The produce is marketed near where it is produced and displayed in bulk or with minimal packaging. Producers can save costs associated with transportation, packaging, and middlemen. Usually there is no direct competitor is sitting beside you. Some common policies is that you can sell only what you produce. You must be available to your customers on a regular basis. The producers need to pay the overhead costs of buildings, utilities, repairs, parking, and taxes. Also location and appearance is the key to successful roadside marketing. [12]
Subscription Marketing: In Subscription Marketing customers meet with the producer before the growing season to prepay for a specified assortment of produce. The Producer packages up the customer’s order delivers it to a drop site or customers may pick their own products at the farm. The farmer keeps a record of the products purchased, but money is not exchanged during the season.The advantage of subscription marketing is that before the season the producer knows what to produce and how much. Also, the crop is sold before it is put in the ground. Pre-payment supplies the producer with funds in advance to grow the crops and operate the farm business. The disadvantage of Subscription Marketing is that customers will expect their produce to be of good quality and available when you told them it would be. For this reason, subscription marketing requires a lot of customer service skills. [13]
Pick Your Own Market: In pick your own market, customers come to the farm and harvest their own produce. The biggest advantage of PYO marketing is the reduction in harvesting costs. Transportation, packaging, handling, and storage are other areas where costs are saved. The producer allows the public to come onto the farm and roam around. therefore the producer has to accept the fact that customers may damage plants and produce and selectively pick the crop. Another downside is bad weather discourages customers, which poses a problem in areas with limited harvest. [14]
Wholesale Markets
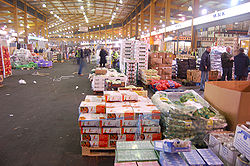
Wholesale marketing is a marketing strategy that can be profitable for both large and small farms. Producers sell their products directly to retailers rather than to middlemen. Retail markets that buy produce directly from the farm include supermarkets and restaurants. In this producers can usually keep more of the profits if they sell directly to a retailer rather than going through a broker/middleman. Producers have the potential to sell large volumes of produce depending on the size of the retailer and whether the retailer has an independent store or a chain of stores. When large quantities of a product are needed to meet the retailer’s demand, producers usually only grow one or two crops. Such limited diversity creates both production and marketing risks. Supplying retailers has its disadvantages,such as transportation costs, grading standards, and, usually, some special handling requirements. Some special packaging may even be necessary. [15]
Organic Fertilizers
Organic Fertilizers are the most convenient forms of fertilizers because they are safe and easily available. Manure, slurry, worm castings, peat moss, seaweed, sewage and guano are few examples. Vegetation material called mulch, such as hay, peat moss, leaves, grass, bark, wood chips, seed hulls, and corn husks all help to aerate the soil, insulate the ground against temperature change, and add needed nutrients. Limestone and rock phosphate are also considered very good Organic Fertilizers. The advantages of organic fertilizers are that it improves the structure of the soil and retains moisture. These types of fertilizers release nitrogen slowly and consistently and mobilize existing soil nutrients. In addition it Does not burn the plants like some chemical fertilizers and is less subject to leaching. The disadvantages is of organic fertilizers is that it contain animal and plant feces are contaminated with pathogens. The composition of organic fertilizers is variable thus it becomes a very dilute and inaccurate source of nutrients. Large amounts of fertilizers should be used to cope up with nutrient requirements. [16]
Inorganic Fertilizers

Inorganic or Chemical Fertilizers are primarily derived from chemical compounds such as ammonium nitrate, ammonium phosphates and potassium chloride. Some examples of Inorganic Fertilizers are Chilean sodium nitrate, mined rock phosphate and limestone. The Advantages of Inorganic Fertilizers are higher and accurate amount of nitrogen promotes protein and chlorophyll and encourages growth of stems and leaves. Higher amount of phosphorus results more flowers, larger fruits, and healthier roots and tubers. The Potassium from potash fosters protein development and thickens stems and leaves. These types of fertilizers release nitrogen rapidly. In addition is is an accurate source of nutrients.Inorganic Fertilizers if used carelessly can burn your plants and distort the quality of your soil leading to cadmium poisoning. Using Inorganic fertilizers would mean that strict watering schedules have to be adopted in order to retain the soil moisture. Also they are made up of elements like Potassium and phosphorus that come from mines or saline lakes thus from limited resources. [17]
Tillage
Tillage is the agricultural preparation of the soil by ploughing, ripping, or turning it. Tillage has four purposes:
- Incorporation of plant residues, fertilizers, etc.
- Seedbed preparation
- Weed control
- Soil and water conservation
In Conservation tillage crops are developed with agricultural biotechnology reduce the need for tillage or plowing, allowing farmers to adopt conservation or “no-till” farming practices. Also known as no-till farming, reduces costs and environmental change by reducing soil erosion and diesel fuel usage. By leaving the farmland undisturbed has increased soil erosion control, while reducing runoff, tractor fuel use and greenhouse gas emission.In ridge tillage (one kind of conservation tillage), farmers plant seeds in the valleys between carefully molded ridges of soil. The method prevents some erosion but usually requires the addition of more fertilizer. In this method farmers leave the stubble or plant residue on the soil’s surface, rather than plowing or disking it into the soil. In the United States alone, farmers have increased no-till farming acres by 35% since 1996. [19]
Greenhouse Gas Emissions (Agriculture)
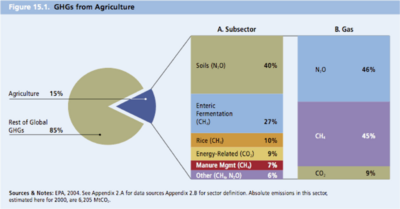
The use of fertilizers on a global scale emits significant quantities of greenhouse gas into the atmosphere. Emissions come about through the use of: animal manures and urea, which release:
- methane,
- nitrous oxide
- ammonia
- carbon dioxide.
Fertilizers that use nitric acid or ammonium bicarbonate, the production and application of which results in emissions of similar gasses. The Total greenhouse gas emissions associated with agriculture amount to less than 10% of all greenhouse gas emissions and they are not increasing, as is often presumed by the public. Among the three major gases, nitrous oxide contributes the largest share of agriculture’s greenhouse gases affecting the U.S. portion of the global warming potential. [20]
Possible Solutions To Reduce GHG Emissions
- Reduce GHG emissions
- Reduce GHG emissions from energy use
- More efficient fertilizer use
- Improved manure management
- Improved animal feed management
- Improved rice cultivation practices
- Increase vegetation and soil carbon stocks
- Land-use changes to increase soil carbon
- Land management practices that increase soil carbon
- Substitute biomass feedstock and products for fossil fuels
- Non-GHG related climate interactions
Food Consumption In New York City
In order to reduce overall greenhouse gas emissions, the average consumption of the population has to be reduced also. Based on our consumption area, a large mega metropolitan region that includes Rockland, Nassau, Westchester, and the Five Boroughs, we illustrate how effective it would be to lower certain parts of our population's consumption. The goal here is to lower meat consumption because the production of food accounts for 83% of food's greenhouse gas emissions, while only 11% of it comes from transportation costs. [22]
Meat Consumption
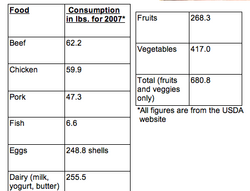
The average American consumes hundreds of pounds of different food every year. In the meat category, beef is the most heavily consumed as the average American consumes up to 62 pounds per year, more than any other meat group. Chicken come to a close second at around 60 pounds. Eggs as you can see, are measured by the number of shells, that's around 250. But meat is nothing when compared to veggies. In total, the average American consumes almost 700 pounds of fruits and veggies per year. [23]
Carbon Intensity of Meat
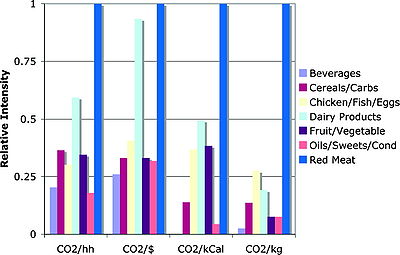
Compared to veggies meat is more carbon intensive, the most intensive being red meat. Now beef, the most widely consumed read meat is the most polluting food group as it production and transportation emits the most CO2 equivalents into the air. The chart to the right breaks down the CO2 emissions from various foods from per houshold, per dollar, per calorie, and to per kilogram. As one can see, Beef is much more polluting and carbon intensive than any other food group. Although Dairy comes as a close second. The reasoning for this is multifaceted, but the main contributor to this is the animals' manure. Cows produce more manure per pound of their meat than any other animal does. This manure releases large amounts of ammonia, methane, and nitrous oxide into the air, greatly adding to the global warming crises.
Reduction in Consumption
Realizing the huge negative impact production of red meat has on the environment, studies were performed to see how much emissions could be reduced if people in our consumption area gave up red meat for one day each week for an year. The results of this study can be seen in the table to the right.
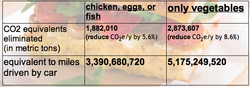
So if for just one day per week for one year all the households replaced their red meat consumption with chicken, eggs, or fish; then our consumption area's CO2 equivalent emissions would be reduced by 5.6 percent. This would be the equivalent of people driving 3.4 billion miles less this year. Now if instead of red meat, we instead consumed just veggies and fruits for one day per week for one year, then we would reduce our emission by 8.6 percent, three percentage points higher than if we replaced our red meat with just chicken, eggs, or fish.
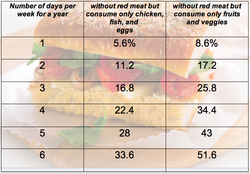
Now some would say that 5.6 percent and 8.6 percent are too small figures. This I agree with, abstaining from red meat and instead eating chicken for one day per week for one year lessens emissions by a pretty small amount. Even with veggies only, it still is a fairly small reduction. But as we can see here, these numbers add up if more days are added in per week where we abstain from consuming red meat. Abstaining one day per week for one year creates a small reduction in emissions, but if we do 4 days a week without red meat but just chicken, fish or eggs, almost a quarter of our consumption area's carbon equivalent emissions from food would be reduced. Even more, if people in our area ate red meat only one day per week for a year and instead ate white meat or fish for the other six, we would reduce our carbon equivalent emissions by over 33%, that's reducing our emissions by a third. Now if we just ate veggies 6 nights and red meat just one day every week, then we would reduce our greenhouse emissions from food by over 50%! These numbers really do add up. In order to help lessen our impact on the environment, we have to just sacrifice a little. Eating red meat less by just a couple days per week can make a huge difference!
Food Transportation
- The transportation of food accounts for nearly 11% of the greenhouse gas emissions associated with food production and consumption. Most of this comes from truck movement, and in terms of the foodshed outlined in this research, it those emissions come largely from trucks at Hunt’s Point Food Distribution center. Emissions from Hunt’s Point have come under scrutiny recently by different environmental groups, so for this portion of our foodshed analysis, we will focus primarily on that distribution center.
Before trucks even arrive at Hunt’s Point, they have contributed to the rising levels of carbon dioxide by the burning of fossil fuels. Of course, trucks all use diesel fuel as gas, but long haul trucks are actually more inefficient than trucks and cars that don’t make such long trips. As seen in Figure 3, trucks like these that travel at speeds up to 75 mph get fewer miles per gallon than trucks that travel at around 45 mph.
- As the largest distribution center in the world, Hunt’s Point is responsible for most food that is shipped to our grocery stores. Over 20,000 trucks a week must stop there to unload cargo. However, most of the time trucks can be seen idling for up to 12 hours at a time, waiting to be inspected by the U.S. Department of Transportation, as trucks carrying food cargo are required to have certain rest periods. In fact, according to one study, truck drivers typically idle their engines while they rest for the mandated US Department of Transportation regulated eight hours or wait to unload. They idle their engines to keep the engine and fuel warm in cold weather, to provide air-conditioning or heat to their sleeper cabs, and to operate appliances.
Overall, carbon emissions from Hunt’s Point have been calculated to be as high as 10,070 grams per truck per hour.
- In light of this, there are now new technologies being developed to curb these emissions. “IdleAire Technologies Corporation of Knoxville, Tennessee has developed an electrification system that brings heating, ventilation and air conditioning (HVAC) to the cab and sleeper compartment via an external device.” This can dramatically cut down emissions, as it uses power from an “external device,” the electric grid, to fuel the truck. This technology is being studied in the Trailer Electrification Project, which has released projections of the decreases in GHG emissions that can be expected if full implementation were to arise.
- Another way that truck emissions may be reduced is by transferring more cargo by barge.
Studies show that barge movement in between Hunt’s Point and many other locations would lead to a decrease in distance traveled, when compared to the distance trucks traveled. However, the time it takes for food to be transported using water routes would be somewhat longer. Although maybe inconvenient, it would be a cleaner way to move goods. Even though it would take longer, as we saw in Figure 3, as trucks move faster, they become less efficient. Therefore, this longer travel time would be beneficial to the environment.
Meat Consumption and Greenhouse Emissions
- Average New Yorker contributes 7.1 metric tons COe2
- this is only 29% of the greenhouse gas footprint of the average American [24]
- Average American consumes about 200 pounds of meat (beef, poultry, and fish)[25]
Problem with Meat Consumption
- Livestock creates 900 million tons of waste annually
- that is 3 tons of waste for each American[26]
- Takes 10 times of resources (land, energy, water) to produce meat relative to equal amounts of vegetarian food[27]
- 30% of ice-free land used to produce meat[28]
How to solve the issue
- Stop subsidizing livestock industry so heavily (globally, 30% of profits from livestock come from subsidies)[29]
- This will raise prices and persuade more Americans to stop buying so much meat
- Raise public awareness of health and environmental problems affiliated with meat
- similar to how we lowered cigarette use
List of Food and their C02 Emissions
Food Group..........................Food...........................CO2 Emissions (in g per kg food)
- Meat and Sausages...............Beef............................13,300
- Meat and Sausages...............Raw Sausages..............8,000
- Meat and Sausages...............Ham (pork)..................4,800
- Meat and Sausages...............Poultry........................3,500
- Meat and Sausages...............Pork............................3,250
- Milk and Dairy Products........Butter..........................23,800
- Milk and Dairy Products........Hard Cheese................8,500
- Milk and Dairy Products........Cream..........................7,600
- Milk and Dairy Products........Eggs.............................1,950
- Milk and Dairy Products........Quark (curd).................1,950
- Milk and Dairy Products........Farmer Cheese..............1,950
- Milk and Dairy Products........Margarine.....................1,350
- Milk and Dairy Products........Yogurt..........................1,250
- Milk and Dairy Products........Milk.................................950
- Fruits...................................Apples..............................550
- Fruits...................................Strawberries......................300
- Baked Good.........................Brown Bread......................750
- Baked Goods.......................White Bread........................650
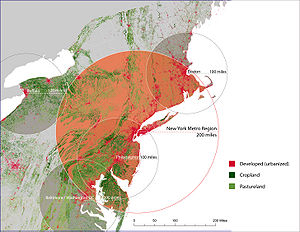
Maps
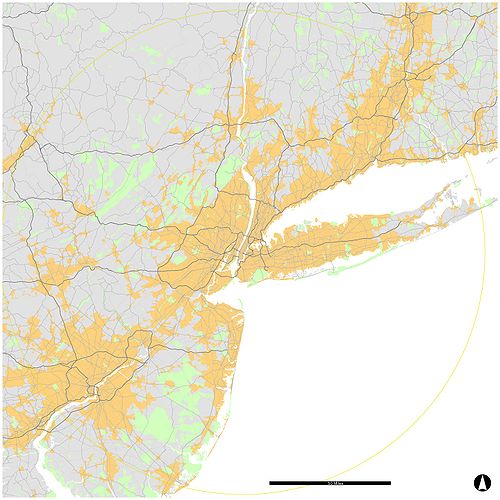
New York region, 200 mile radius shown
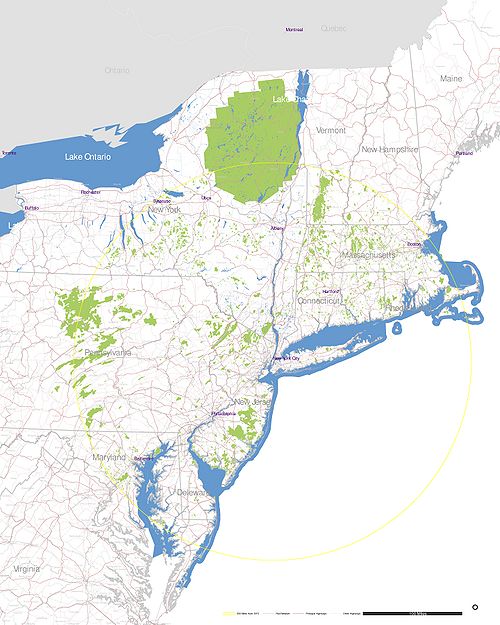
North East region, 200 mile radius shown

![[3]](http://pubs.acs.org/appl/literatum/publisher/achs/journals/production/esthag/2008/esthag.2008.42.issue-10/es702969f/images/large/es-2007-02969f_0001.jpeg)