Views

Contents |
CHANGE OVER TIME IN FRESH MEADOWS
Racial Makeup
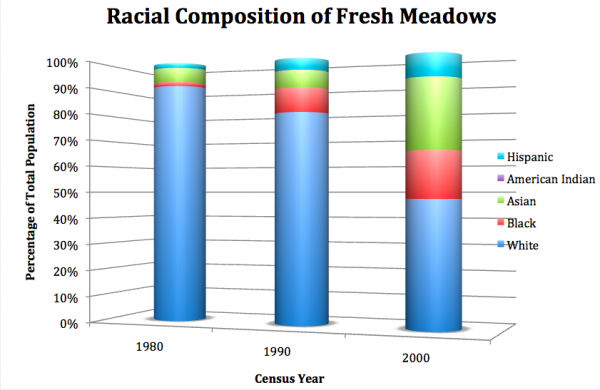
The racial makeup of Fresh Meadows has undergone extensive changes over the past three decades. Since its farmland history, Fresh Meadows had always been a predominately white neighborhood, and during the early twentieth century it became predominately Jewish. The 1980 census reflects this, as whites made up 91% of the population, with Asians as the second largest group at a mere 5%.[2]
With the dawning of the 1990s, whites still made up a large majority of the population, at 80%, yet African Americans were now the second largest group at 10%. American Indians even comprised 4% of the population during 1990.[3] The influx of blacks into the community is the most interesting change, as it can be partially attributed to the removal of structural factors preventing black residence in the Fresh Meadows Housing Development. In 1983, the NAACP Legal Defense Fund filed a federal lawsuit against the development’s management firm, Helmsley-Spear, alleging “a denial of housing to black applicants for the reason that they are black,” according to the case.[4] In December 1984, Helmsley-Spear settled the case by paying a total of $615,000 to blacks who were wrongfully told that no apartments were available in the complex and giving “priority housing” to blacks in sixty units that were “kept vacant pending the outcome” of the lawsuit.[5] Although refusing to admit to racial discrimination, Helmsley-Spear eliminated any indications of it and allowed blacks to enter the housing community.
By 2000, Fresh Meadows had undergone a complete transformation. Whites had become the majority minority, with no group making up more than 50% of the population. Whites stood at 47%, with Asians at 26%, blacks at 17% and Hispanics at 4%.[6] This change infused diversity into the schools of the area, directly affecting the educational experiences of thousands of youngsters.
School Demographics
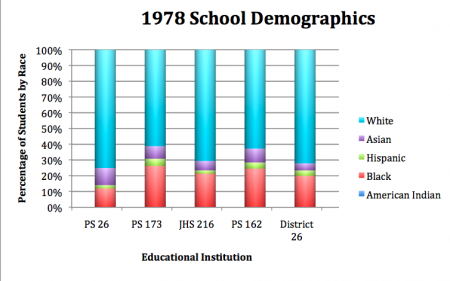
Following a highly publicized battle between District 26 administrators and the chancellor of New York City schools, ethnic data for the district’s schools was finally released in 1978.[8] Whites made up a majority of students at each school in Fresh Meadows, the lowest percentage of whites being 61% at PS 173 and PS 162, and the highest being 75% at PS 26, a school built by the New York Life Insurance Company as part of the Fresh Meadows Development. It is not surprising that this school has the smallest black population, 12%, because of the racial discrimination practiced until 1983 by the Development. The other four schools contained black populations of around 20%. Asians composed between 6% and 10% of the school population, higher than the district average of 4.5%. Hispanics made up less than 5% of students in each school, and no American Indians were present in any of the schools.[9]
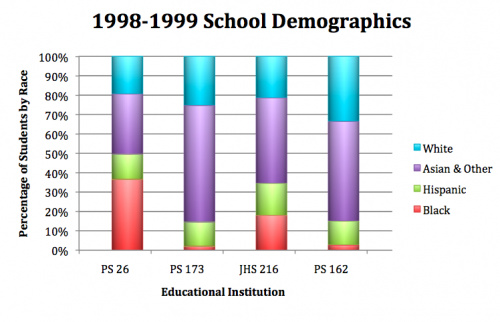
By the 1998-1999 school year, things had changed drastically. Whites made up between 19% and 33% of the student populations. PS 26, the least black school in 1978, had double the percentage of black students than any other Fresh Meadows school, at 36.5%. Asians became the majority group, making up 60% of PS 173, 50% of PS 162, yet surprisingly only 21% of PS 26. The Hispanic population had grown to around 12% for each school.[11]
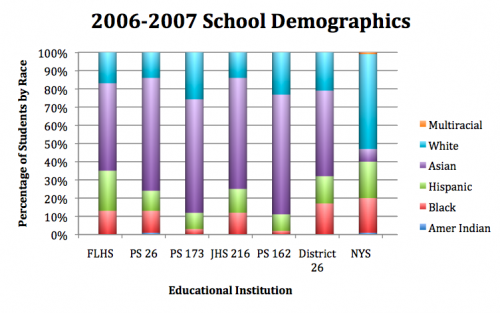
In the most recent data available, from the 2006-2007 school year, even more demographic changes can be seen. Whites dropped to 14% of the student population in PS 26 and JHS 216, 26% of PS 173, and 23% of PS 162. Each of the schools had at least a 60% Asian student body, while the percentage of Hispanics generally remained constant in these schools. The black population plummeted to 3% at PS 173 and 2% at PS 162, a far cry from the approximately 25% found in these schools in 1978. PS 26 became the first school to report any American Indians (1%) in the three years of data analyzed here.[12]
In fact, changes related to this diversity can even be seen in the administrations of schools in Fresh Meadows. Between 2003 and 2008, three schools within 10 blocks of each other, PS 173, JHS 216, and Francis Lewis High School, saw the retirement of a principal and the need to appoint a replacement. In all three schools, the retiring principal was a white Jew, indicative of the old demographic makeup. Reflecting the new demographics of Fresh Meadows, PS 173 hired an Asian principal, JHS 216 an African-American principal, and Francis Lewis High School a principal of Arabian-Brazilian descent.
Educational Attainment
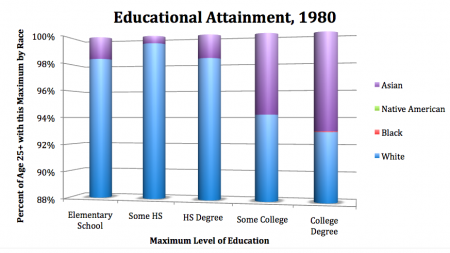
Altogether, this data provides some interesting trends to consider. This statistic can give insight into population changes in the neighborhood to a greater degree than a simple race statistic can.
In 1980s, whites never made up less than 90% of any maximum level of education. Although whites hold a strong majority in each category, Asian percentages rise as the level of education increases. In fact, while 47% of whites received a high school degree or less, only 16% of Asians did so.[15] This fits into the notion of the “model minority,” dictating that Asians strive for high degrees of education and are among the smartest groups in America.[16]
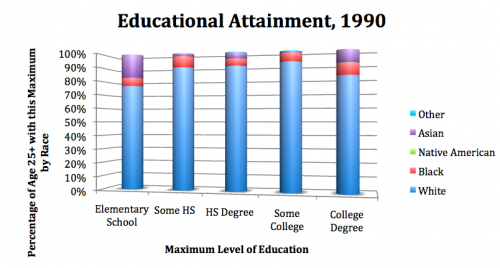
In the 1990s, blacks actually comprise a greater percentage of those with some form of a college degree than they do in any other level of educational attainment. The black population moving into Fresh Meadows during the 1980s is therefore generally well educated, which may be indicative of real estate steering practices filtering out those with less education. Asians were more likely to settle for a high school degree or less (17% received only elementary school education), which may indicate a larger proportion of new immigrants to America from Asia who received less schooling in their home countries.[18]
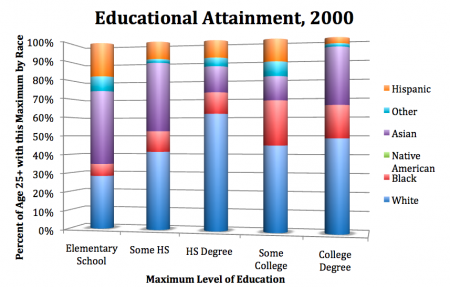
The 2000 census shows a significant population shift in Fresh Meadows, as the only category in which whites hold a majority is receiving a maximum of a high school degree. Asians tend toward the two extremes, either receiving only elementary/some high school education or a college degree; very few Asians who entered college failed to complete it. More Fresh Meadows blacks completed at least some college than any other category, but there seem to be factors in place that prevented Hispanics from achieving college degree, as more than half of those who entered college end up dropping out before receiving some sort of a degree.[20] Despite this, it is important to recognize that a majority of Hispanics were able to enter college.
Educational Enrollment
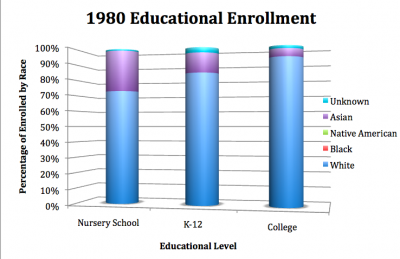
As with most other statistics, 1980 saw white dominance in nursery schools, K-12 schools, and colleges. Asian prevalence decreased as the level of education increased—they made up the largest percentage of nursery school attendees despite the low number of Asians in nursery school. This is because of especially low white levels of nursery school enrollment, which may indicate a lesser concern for preprimary education by whites than by minority groups. Whites dominated the college landscape, making up 93% of college attendees.[22]
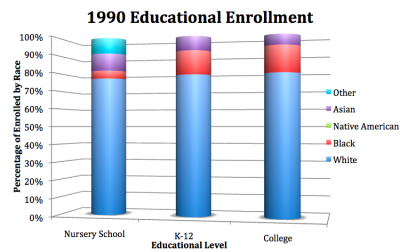
The 1990 census revealed significantly different results, with blacks making up larger percentages than Asians in both K-12 and college enrollment, a surprising result considering the myth of the “model minority.” White enrollment was consistent, making up approximately 80% of those enrolled at each level of education, with the other 20% being composed of by Asians and blacks. The only exception to this is in nursery school, where 9% of those enrolled identified themselves as “other” on the race question of the census.[24]
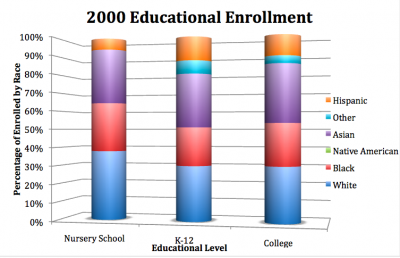
As is true with almost every racially based statistic for Fresh Meadows, the largest change in data was during 2000 census. Whites dropped to approximately 30% of those enrolled in each level of education, with Asians also making up 30%. Blacks were consistently around 20% of the population, and Hispanic presence in K-12 and college was close to 10%.[26] Thus, although in 2000, few Hispanics had achieved a college degree, as can be seen in in the educational attainment statistic, many were in the process of doing so, possibly accounting for second-generation upward mobility.
References
- ↑ Infoshare Online. 1 Apr. 2009 <http://infoshare.org>.
- ↑ Infoshare Online. 1 Apr. 2009 http://infoshare.org
- ↑ Infoshare Online. 1 Apr. 2009 http://infoshare.org
- ↑ McKelvey, Gerald. "Helmsley-Spear Sued for Race Bias." Newsday [New York City] 5 Nov. 1983.
- ↑ Ain, Stewart. "Housing Suit Pact." New York Daily News 6 Dec. 1984.
- ↑ Infoshare Online. 1 Apr. 2009 http://infoshare.org
- ↑ Mitchell, Allison. "Skeptical District 26 Sends Data." Newsday 20 Mar. 1978.
- ↑ Gianotti, Peter M. "School Chief in District 26 Is Taken To Task In Data Hunt." Newsday [New York City] 4 Mar. 1978.
- ↑ Mitchell, Allison. "Skeptical District 26 Sends Data." Newsday [New York City] 20 Mar. 1978.
- ↑ Queens Neighborhoods: School Choice. Queens Library, Long Island Division: Schools-Queens- District 26.
- ↑ Queens Neighborhoods: School Choice. Queens Library, Long Island Division: Schools-Queens-District 26.
- ↑ nySTART - New York State Testing and Accountability Reporting Tool. 10 Apr. 2009 <http://www.nystart.gov>.
- ↑ nySTART - New York State Testing and Accountability Reporting Tool. 10 Apr. 2009 <http://www.nystart.gov>.
- ↑ Infoshare Online. 1 Apr. 2009 <http://infoshare.org>.
- ↑ Infoshare Online. 1 Apr. 2009 http://infoshare.org
- ↑ Lee, Sara S. "Class Matters." Becoming New Yorkers: Ethnographies of the New Second Generation. Ed. Philip Kasinitz, John H. Mollenkopf, and Mary C. Waters. Minneapolis: Russell Sage Foundation Publications, 2006. 313.
- ↑ Infoshare Online. 1 Apr. 2009 <http://infoshare.org>.
- ↑ Infoshare Online. 1 Apr. 2009 http://infoshare.org
- ↑ Infoshare Online. 1 Apr. 2009 <http://infoshare.org>.
- ↑ Infoshare Online. 1 Apr. 2009 http://infoshare.org
- ↑ Infoshare Online. 1 Apr. 2009 <http://infoshare.org>.
- ↑ Infoshare Online. 1 Apr. 2009 http://infoshare.org
- ↑ Infoshare Online. 1 Apr. 2009 <http://infoshare.org>.
- ↑ Infoshare Online. 1 Apr. 2009 http://infoshare.org
- ↑ Infoshare Online. 1 Apr. 2009 <http://infoshare.org>.
- ↑ Infoshare Online. 1 Apr. 2009 http://infoshare.org