File:Media graph 1.jpg
From The Peopling of New York City

Size of this preview: 320 × 197 pixels
Full resolution (657 × 405 pixels, file size: 51 KB, MIME type: image/jpeg)
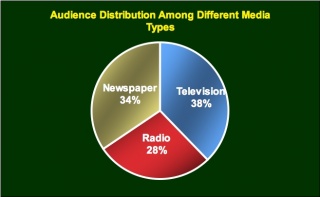
A pie graph indicating the distribution of audience preferences among television, radio, and print news.
File history
Click on a date/time to view the file as it appeared at that time.
| Date/Time | Thumbnail | Dimensions | User | Comment | |
|---|---|---|---|---|---|
| current | 03:20, 27 April 2007 |  | 657×405 (51 KB) | JustHarisBhatti (Talk | contribs) | (A pie graph indicating the distribution of audience preferences among television, radio, and print news.) |
- Edit this file using an external application (See the setup instructions for more information)
File links
The following page links to this file: