Views
Contents |
Contemporary Profile: A Glance
According to the Sunnyside fact sheet of 2000 Census statistics by Hunter College Department of Urban Affairs and Planning, Sunnyside has a population of 53,736 people, which represents a growth of 12.5 percent from 1990. Of that total, 39 percent are Latino, 22 percent Asian, 33 percent white, and 2 percent black. 61 percent of the population are also foreign-born, with 48 percent being "newly arrived" (in that they came to the United States in 1990 or later). The top ten countries of origin are Ecuador, Colombia, Korea, Mexico, Bangladesh, China, Dominican Republic, Romania, India, and Ireland. Recent Irish immigration has also helped reinforce the neighborhood's traditional Irish roots.
The commercial strips of Greenpoint Avenue, Queens Boulevard, and Skillman Avenue provide much of Sunnyside's economic activity.[1] Greenpoint Avenue tends to contain Latin American stores such as Carnicería el Paisa, a butchers, and Café Colombia, a bakery. Queens Boulevard is noted for its Irish pubs and chain stores, and also contains diners and Turkish restaurants. Skillman Avenue is not dominated by any one nationality, with stores, markets and restaurants derived from cultures all over the world.[2]
Sunnyside is designated under Queens Community Board #2 along with Woodside, and Long Island City. Elected officials currently serving Sunnyside and surrounding neighborhoods are Eric Gioia (New York City Council District #26), Catherine Nolan (New York State Assembly District #37), George Onorato (New York State Senate District #12), and Nydia M. Velasquez (U.S. Congressional District #12).
Some of Sunnyside's community organizations and centers include Sunnyside Community Services, Sunnyside Chamber of Commerce, the Thalia Spanish Theatre, as well as Sunnyside Community Senior Center.
Schools in or nearby Sunnyside include PS 199 and PS 150, public elementary schools; IS 125, a public junior high school; Aviation Career & Technical HS and Queens Vocational HS, public high schools; and Queens of Angels R.C. School and St. Raphael's R.C. School, private/parochial schools.
Emergency services include police, firefighters, and hospital services. The 108th Precinct of the Police Department patrols Sunnyside while firefighters from Engine 325, Ladder 163 are at Sunnyside's call. The Elmhurst Hospital Center is also available to Sunnyside residents.
Newspapers servicing Sunnyside include the Queens Tribune, Woodside Herald, and Woodside Times.
Parks and playgrounds such as the Noonan Playground and the Lou Lodati Playground are also available to residents.
Ethnic and Racial Composition
The following are charts of the ethnic and racial composition of Sunnyside according to the 2000 Census statistics compiled at the Queens Library website:

The first chart on the left presents the percentage of residents that are Hispanic or Latino versus those who are not Hispanic or Latino. The total number of respondents who answered this question was 42,353. There are 17,212 Hispanic or Latino residents versus 25,141 residents who are not Hispanic or Latino.
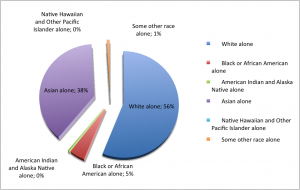
The second chart on the right presents the percentages of the breakdown of non-Hispanic or Latino residents according to single-race categories. 25,141 residents reported that they were not of Hispanic or Latino origin. Of those residents, 23,647 reported that they belonged to one racial category. Of that number, 13,272 reported being White alone, 1,048 reported being Black or African American alone, 83 reported being American Indian and Alaska Native alone, 9,020 reported being Asian alone, 10 reported being Native Hawaiian and Other Pacific Islander alone, and 214 reported being Some other race alone.
Of the 25,141 residents who reported not being of Hispanic or Latino origin, 1,494 reported belonging to two or more races (with the rest belonging to single-race categories as stated above).
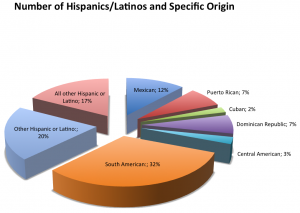
The third chart on the left presents the percentages of the breakdown of Hispanic or Latino residents according to specific regional or national origin. 17,212 residents reported being of Hispanic or Latino origin. Of that total, 2,456 or 5.8 percent of Hispanic/Latino residents reported being Mexican. 1,533 or 3.6 percent reported being Puerto Rican, while 430 or 1 percent reported being Cuban. 1,454 or 3.4 percent reported being Dominican. Of the 535 or 1.3 percent that reported coming from Central America, Hondurans and Salvadorans consisted of the two largest Central American groups, making up 25.6 percent and 34.8 percent respectively of all Central Americans. 6,643 or 15.7 percent reported that they came from South America, with the two largest South American groups, Colombians and Ecuadorians, making up 37.2 percent and 45.2 percent respectively of all South Americans. 4,161 or 9.8 percent reported being Other Hispanic, which consisted of the categories of Spaniard, Spanish, and Spanish American. Lastly, 3,619 or 8.5 percent reported being All other Hispanic or Latino.
Composition of Foreign-Born
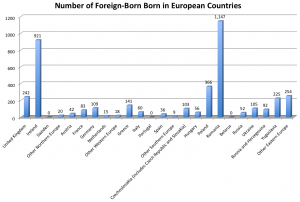
The total number of foreign-born in Sunnyside is 25,714 or 61% of all Sunnyside's residents who reported belonging to a racial or ethnic category. Out of that total, 4,096 or 15.9 percent of foreign-born came from European countries. 1,183 or 28.9 percent of European foreign-born came from Northern Europe, which comprises the United Kingdom, Ireland, Sweden, and Other Northern Europe categories in the chart. Only 6.5 percent of European foreign-born came from Western Europe, comprising Austria, France, Germany, Netherlands, and Other Western Europe, and likewise, 6 percent from Southern Europe, consisting of Greece, Italy, Portugal, Spain, and Other Southern Europe. The largest amount of European foreign-born (2,400 or 58.6 percent) came from the countries of Eastern Europe, which consists of Czechoslovakia (includes Czech Republic and Slovakia), Hungary, Poland, Romania, Belarus, Russia, Ukraine, Bosnia and Herzegovina, Yugoslavia, and Other Eastern Europe.
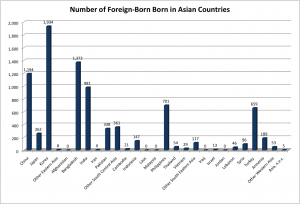
Out of the total of foreign-born, 8,586 or 33.4 percent reported being born in Asian countries. 3,398 or 39.6 percent of all Asian foreign-born reported coming from Eastern Asia, which includes China (with figures counted separately for the mainland, Hong Kong, and Taiwan), Japan, Korea, and Other Eastern Asia. 3,058 or 35.6 percent of Asian foreign-born came from South Central Asia, which includes Afghanistan, Bangladesh, India, Pakistan, and Other South Central Asia. 1,069 or 12.5 percent came from South Eastern Asia, which includes Cambodia, Indonesia, Laos, Malaysia, Philippines, Thailand, Vietnam, and Other South Eastern Asia. 1,056 or 12.3 percent came from Western Asia, which comprises Iraq, Israel, Jordan, Lebanon, Syria, Turkey, Armenia, and Other Western Asia. Lastly, a negligible amount of Asian foreign-born came from Asia, n.e.c.
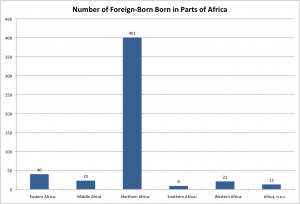
Out of all foreign-born, 507 or 2 percent reported being born in different parts of Africa. 40 or 7.9 percent of African foreign-born reported being born in Eastern Africa, which includes Ethiopia and Other Eastern Africa. 23 or 4.5 percent reported being born in Middle Africa. The bulk of African foreign-born (401 or 79.1 percent of African foreign-born) reported being born in Northern Africa, which includes Egypt and Other Northern Africa. Negligible amounts of African foreign-born came from Southern and Western Africa and Africa, n.e.c.
Educational Attainment
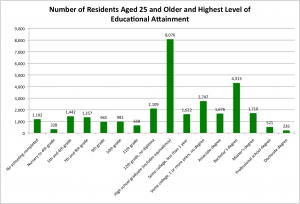
Educational attainment data was obtained through measuring highest educational level achieved by residents aged 25 and older. The total number of residents aged 25 and older was 29,923. The data below thus presents the breakdown in highest educational level achieved among those 29,923 residents:
30.2 percent of residents aged 25 or older did not complete school or only completed it until high school, whereupon they did not receive their high school diploma. For 27 percent, their highest level of educational attainment was high school or its equivalent. 14.6 percent had some college education but did not have a degree. 5.6 percent obtained an associate degree, while 14.4 percent received a bachelor's degree, for a combined total of 20 percent having at least an undergraduate degree. Lastly, 8.2 percent of residents obtained graduate degrees or higher.
Income Composition
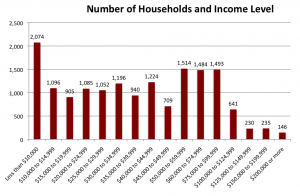
The total number of households in Sunnyside is 16,024. It is from that total that the chart presents a breakdown according to income level.
If middle-class or middle-income status derives from the middle 20 percent range of incomes, which as of 2006 is between $37,771 to $60,000 for all households on average,[3] then 27.4 percent of Sunnyside households are middle-class. Following from this assumption of the middle 20 percent range determining middle-class or middle-income status, 46.2 percent of residents are below middle-class status (though not necessarily living in abject poverty), while 26.4 percent of residents are above middle-class status (though not necessarily living in absolute luxury).
Go to Housing and Immigration.
References
- ↑ http://www.newsday.com/news/local/newyork/ny-nycity1223,0,3681853,print.story
- ↑ Jeff Vandam, "An Enclave at Once Sung and Inclusive," New York Times, 4 Feb. 2007, 18 Mar. 2009 <http://www.nytimes.com/2007/02/04/realestate/04livi.html?sq=sunnyside&st=cse&scp=1&pagewanted=print>
- ↑ http://www.taxfoundation.org/research/show/22600.html
This page was created by Amy Lu.