D E M O G R A P H I C SFrom The Peopling of New York City
Demographics
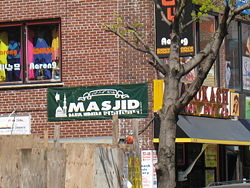 When you walk through Jackson Heights and listen to your surroundings, you not only hear the seven train whirring by but the members of the neighborhood chattering away. Whether it is conversing for a business transaction or someone talking on his or her cellular phone, English doesn’t appear to be the primary language. According to the 2000 Census data collected, English is only the primary language in fewer than 20% of households in Jackson Heights. Most of the languages spoken in Jackson Heights are Spanish, Italian, Chinese, Korean, Japanese, Hindi, Gujarathi, Urdu, Russian, French, Portuguese, German, Greek, Thai, Tagalog, and Arabic. The major South Asian languages such as Hindi, Gujarati, Arabic, and Urdu appear to be most concentrated in the section of Jackson Heights known as “Little India”. Little India is a concentration of South Asian culture, with stores, restaurants, and a movie theatre catering to this specific population. Almost all of the business owners in this area can speak these South Asian languages. The music and movie stores available also sell products in these languages spoken. Besides customers coming in from the neighborhood, many people residing in New York City travel to Little India to obtain provisions not usually found in the majority of the stores. The ethnicity and ancestry of the residents of Jackson Heights are what accounts for the diversity of the languages spoken in the neighborhood. With 17% of Jackson Heights of Asian and Middle Eastern ethnicity, many originate from countries such as India (4.8% of residents of Jackson Heights), China (5.3%), Pakistan (.8%), Bangladesh (1.3%), Afghanistan (.3%), Arab (.7%), Israel, Iran, Iraq, Indonesia, Korea, Japan, Vietnam, Taiwan, Sri Lanka and Philippines. Many of these people tend to belong to some of the major religious groups. They tend to follow the religions of Buddhism, Hinduism, Islam, Sikhism, Jainism, Taoism and Shinto.
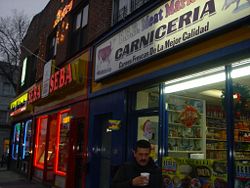 Although 74th Street is the seven-train stop for Little India, it is not the only stop in Jackson Heights. Walk up a few blocks towards 80th St. or 90th St. and a new culture emerges. The large Hispanic population is visible in the stores and restaurants seen as you walk around. About 56% of Jackson Heights is Hispanic, making it the largest ethnic group of this neighborhood and making the most popular foreign language Spanish. Restaurants such as Pio Pio and Natives cater to Peruvian and Colombian residents or those who want to experience the food of these cultures. The ancestry of the Hispanic population of Jackson Heights is spread out, further exemplifying the diversity. About 9.9% of the residents are Colombian, 7.8% Mexican, 5.9% originating from the Dominican republic, 8.7% of Ecuadorian ancestry, 3.6% Puerto Rican, 1.8% Peruvian, and there exists even more South American and Central American countries in the ancestry record of Jackson Heights. Even with so many countries represented in one neighborhood, there exist stores and products that cater to the representatives of these countries. Although the Asian and Hispanic cultures are most visible in the neighborhood, they aren’t the only ethnicities that make it up. About 3% of the residents are of African American identity, 21% are of Caucasian identity, and 3% belongs to an unspecified or “other” category. Although they are not as strongly represented as the significant ethnicities in the area, they still contribute to the society in economic and social aspects. They still own some of the businesses in the neighborhood and also purchase products from the cultures they are constantly exposed to.
References
| ||||||||||||||||||||||||||||||||||||