DemographicsFrom The Peopling of New York City
DemographicsThe following maps and tables are of data collected in 2000 by the Downtown Manhattan Community Development Corporation (DMCDC) and released on the Rebuild Chinatown Initiative (RCI) website. [1]
Races In Chinatown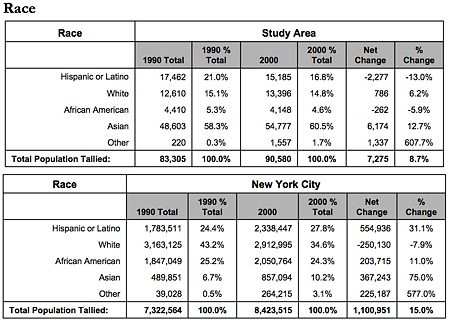
Asian Population In ChinatownOverall, the study shows an increase in the Asian population (In New York City, Manhattan, and in the Study Area). As noted in the data from the previous tables, there is a significantly higher percentage of Asians in Chinatown than in New York City as a whole. More specifically, the map shows that the percentage of Asians in the geographical bottom-center (tracks 16 and 8), is dramatically higher than that of the other tracts. One would expect to see a higher density of Asians in these areas. 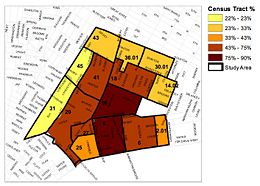 
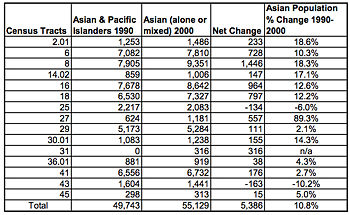
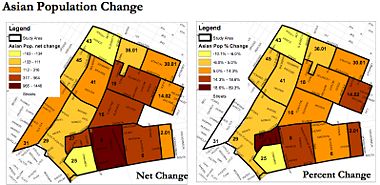
Changes in Chinatown's Asian PopulationIn studies on the change in Chinatown’s Asian population, the only tracts that demonstrated a decrease in Asian population were tracts 25 and 43, which are at the top mid-left and bottom mid-left respectively. Though this may be a large jump in speculation, one could suggest that other race populations are “moving inward” from the upper and lower left borders.
Median Household Incomes and Household Sizes in Chinatown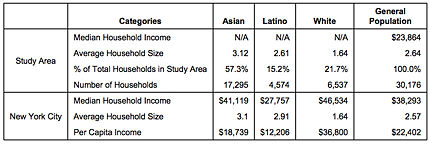 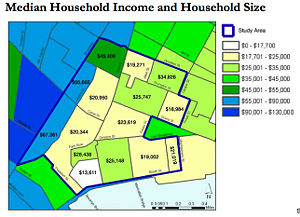 This map has very powerful implications in terms of social class and its relationship with immigrant populations. The most prominent aspect of the data is that to the left and below the study area there is extremely higher average household incomes. The differences from track to track skip 2-3 “steps” in some instances. The tracks above the study area are also higher but still “green”, so there is not the same level of drastic difference. Also, it appears that the closer to the center, the lower the income, with exception to the track with an average income of $13,611. Some reasons for the drastic drop in household income in the study area can be that where there are more foreign born inhabitants, particularly non-citizens who were not able to get an education, unskilled labor is providing for the household income.
Citizenship and Immigration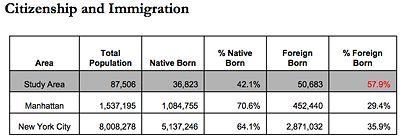 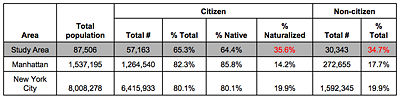
There is 22% more foreign-born persons in the study area than in New York City as a whole, which is a significant amount. The percentage of naturalized and non-citizens in the study area is also significantly higher in the study area than in the New York City population as a whole. There proportionately 17% more non-citizens in Chinatown than the percentage of non-citizen immigrants in New York City.
Age Distribution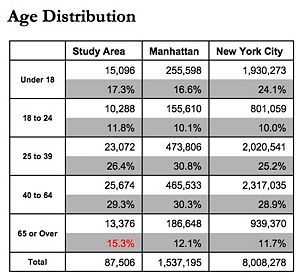
The data on age in the study area shows that the study area has a much larger percentage of people 65 and older than in Manhattan and New York City. This may mean that for the next census, there will very different data because a large portion of the elderly population, which holds much sway because of its size, will have passed away (in a 10 year gap)
References
|